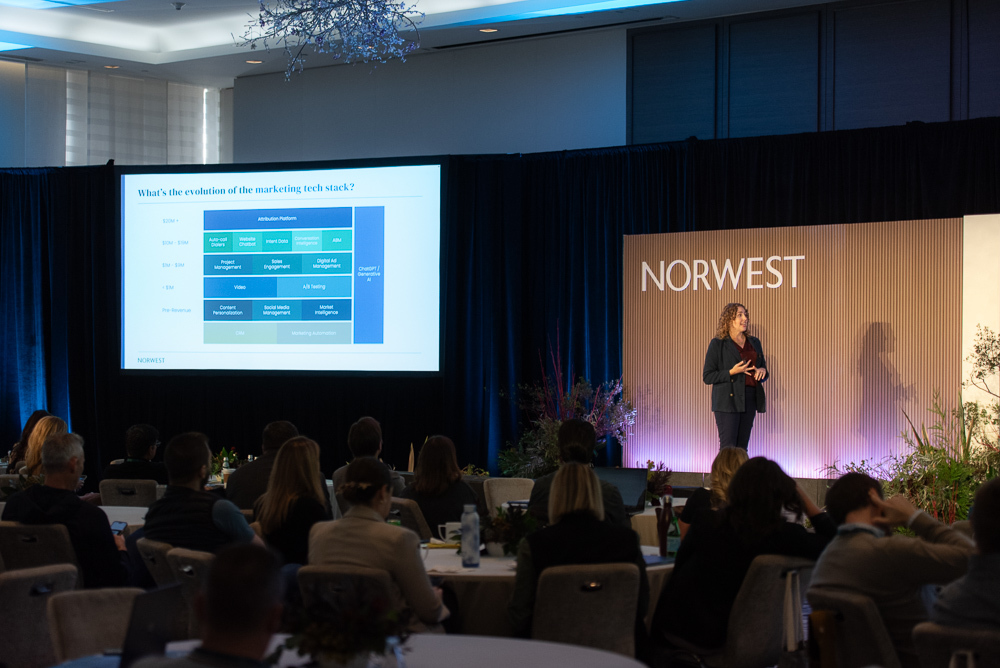
2023 has been busy, y’all. Norwest’s go-to-market (GTM) operating executives have been working shoulder-to-shoulder with our portfolio companies to navigate challenges in this current climate. Achieving efficient growth is hard work, especially when the costs of paid programs are increasing while at the same time your cash burn needs to decrease.
Creating a community for GTM portfolio leaders is one of many ways we’re supporting our companies. Our Norwest portfolio leader communities have met in several forums throughout this year with in-person and online huddles, CMO dinners, sales breakfasts and webinars, and our recent growth marketing summit with over 100 attendees. We need each other’s support to navigate growth in these challenging times together.
That’s why we prioritized the launch of Norwest’s first B2B Sales & Marketing Benchmark Survey this year. As our companies head into 2024, we want to arm them with as many tools as possible to aid their planning efforts. Benchmarking can shine a light on where we should challenge the status quo to operate differently in the future.
Benchmarking can shine a light on where we should challenge the status quo to operate differently in the future.
A few months back we fielded the survey to Norwest’s B2B venture capital portfolio companies in North America and Israel. We invited both marketing and sales leaders to participate because we wanted to give GTM teams a more complete picture of what other companies are doing to drive growth. We hope it will spark conversations for refining their playbooks as they plan for next year.
Here are a few of the takeaways from the survey, combined with my observations from working with dozens of Norwest’s companies this year:
Plan for long sales cycles, even in mid-market.
Deal slippage has been real this year. If you’re planning for anything less than 6 month sales cycles, you’re setting yourself up for failure.
Our sales leaders shared that even at ACVs as low as $25K-50K, deals were averaging over 5 months. Anything over $50K was taking 6 months or longer to close. And it’s even tougher for enterprise sales, with deals over $100K closing in 8 months or longer.
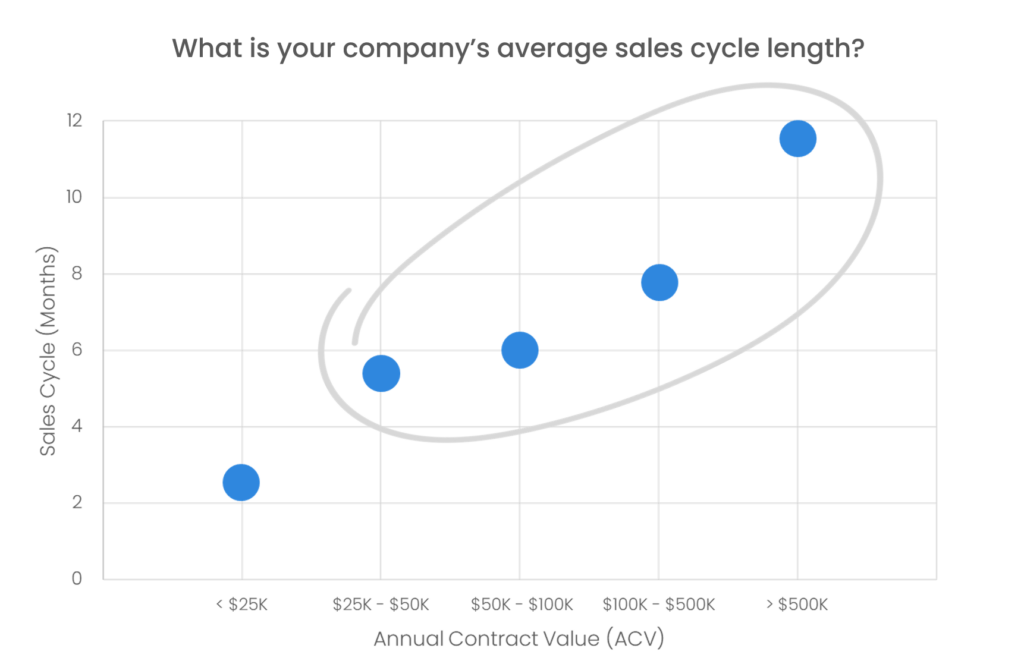
It’s no surprise that the higher the deal size, the longer the sales cycle. But companies need to build in a bit more time into their velocity models than they have in the past, and sales leaders should manage their pipeline accordingly.
Know that right now in December 2023, you’re realistically creating new pipe for the second half of 2024. And that’s just the tip of the iceberg for marketing programs. The choices you make in your demand generation programs today will show up in closed business at the end of 2024 – at best – and more likely in 2025.
Prepare for your budgets to come down.
We found that in 2023, cash burn on marketing and sales was running a bit hot. Earlier stage companies under $20M ARR have been budgeting about 66-76 percent of previous fiscal year’s closing ARR on their marketing and sales efforts. That means companies are relying heavily on cash in the bank to fund their go-to-market machine.
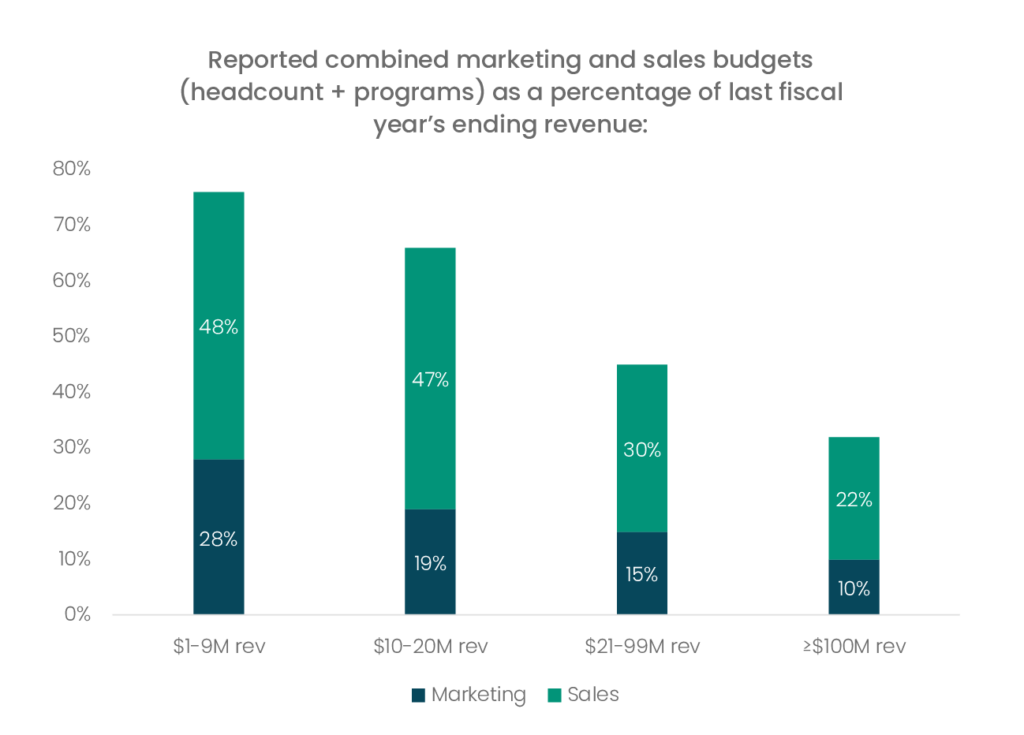
Marketing and sales leaders in venture-backed companies will need to start thinking a little more like their bootstrapped counterparts. Challenge yourselves: What parts of our tech stack can we consolidate? Should our participation level in this tradeshow come down (or go away entirely)? Are we hiring based on a top-down plan for our targets (e.g. we set a growth target, so let’s hire X number of warm bodies to hit it) or bottom-up analysis of where our business is at (e.g. a more realistic goal set by looking at the top-of-funnel demand we’ve created and staffing incrementally to capture and manage opportunities)?
Avoid the temptation to “spray and pray” as you reduce spend.
Paid media is only getting more expensive. Meanwhile your budgets have taken a hit. You can no longer spend your way to hitting your goals, and you’ve got to get creative.
That means you can’t go back to a dry well of dusty tactics. We asked our marketing leaders what they’d prioritize keeping if their budgets were cut, and the second-highest rated tactic was outbound email. Not that surprising when you think about the conventional idea that email is “free,” right? But the kicker is that email was rated second to last on the list of channels that contribute to sourced opportunities. So why are we prioritizing it so highly?
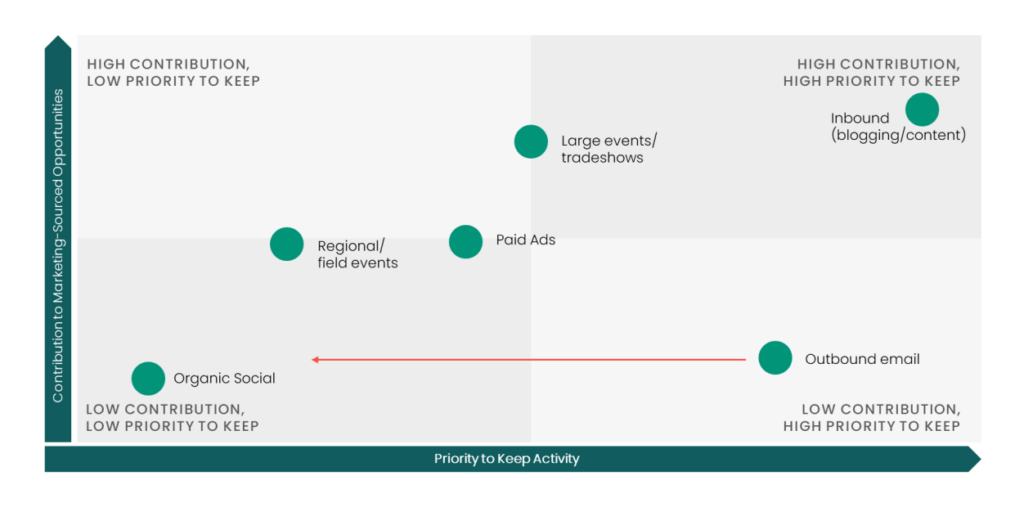
And email is not free, really. How are you building that engaged database? Email quickly has diminishing returns if you’re not getting in front of new audiences. And you can’t simply send a higher quantity of emails in a given week without creating list fatigue.
Think about how you can keep getting in front of new audiences in a lower cost way. For example, let’s look at events. Maybe your tradeshow spend goes down. Some shows you might eliminate entirely, but you can also get creative and scale back your sponsorship while still participating. Send strong networkers to the event in lieu of a booth. Pay a lower cost for a traditional outdoor ad near the event entrance for $5,000 instead of sponsoring the wifi for $12,000. Run a contest via a low-cost survey to find out who will be attending the show so you can target people more accurately to set up meetings.
Testing alternative tactics will require you to be both creative and courageous.
Consider the total cost of ownership for your tech stack.
By around $10-20M in ARR our survey respondents are primarily using Salesforce as CRM and Marketo for marketing automation. While HubSpot was reported as the dominant choice for both CRM and marketing automation in the earliest days of a company, sales leaders overwhelmingly reported Salesforce as the CRM choice once reaching single digit millions in revenue.
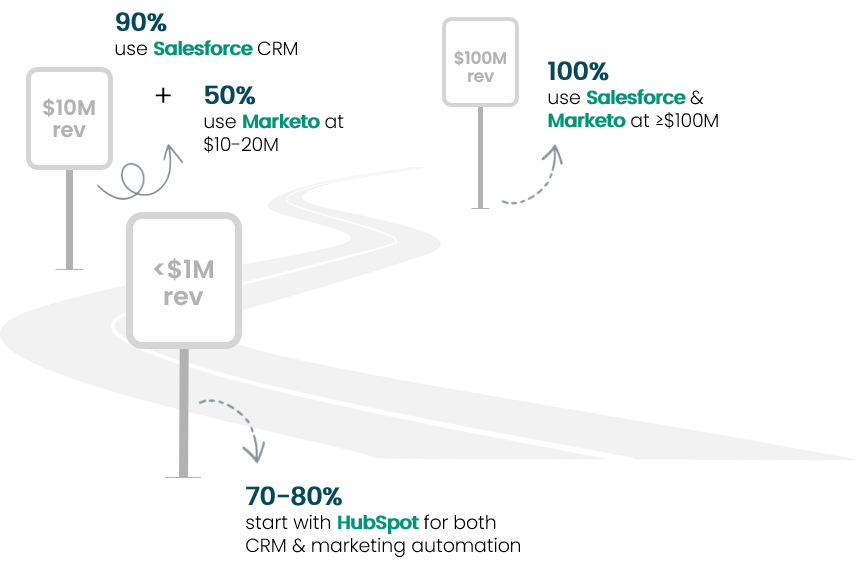
One hypothesis for this, beyond capabilities of the tooling, is that marketing and sales leaders stick with what they know and are comfortable with for running their business. But it’s also been my experience that both Salesforce and Marketo can lead to more revops complexity – yes, the capabilities are robust, but is your team resourced to work efficiently in both platforms?
If teams get leaner, we may see marketing and sales leaders optimizing more for ease of use. They might be willing to stick with HubSpot longer, or they could explore platforms with transparent pricing and improved usability, like Copper CRM and Act-On for marketing automation.
SDR / BDR reporting line can help with alignment, but it’s not the silver bullet.
When we asked marketing and sales leaders who their SDR / BDR teams report into, the results were split right down the middle – half of the time the team is with marketing and half it’s with sales.
But an interesting trend emerged when we pivoted the responses by company growth size. Under $10M in ARR, half of the companies had both inbound and outbound teams reporting into sales, with 38 percent having a split between inbound with marketing and outbound with sales. Once companies grew to $10M in ARR, we saw a dramatic shift with the full team (inbound and outbound) reporting into marketing 60 percent of the time.
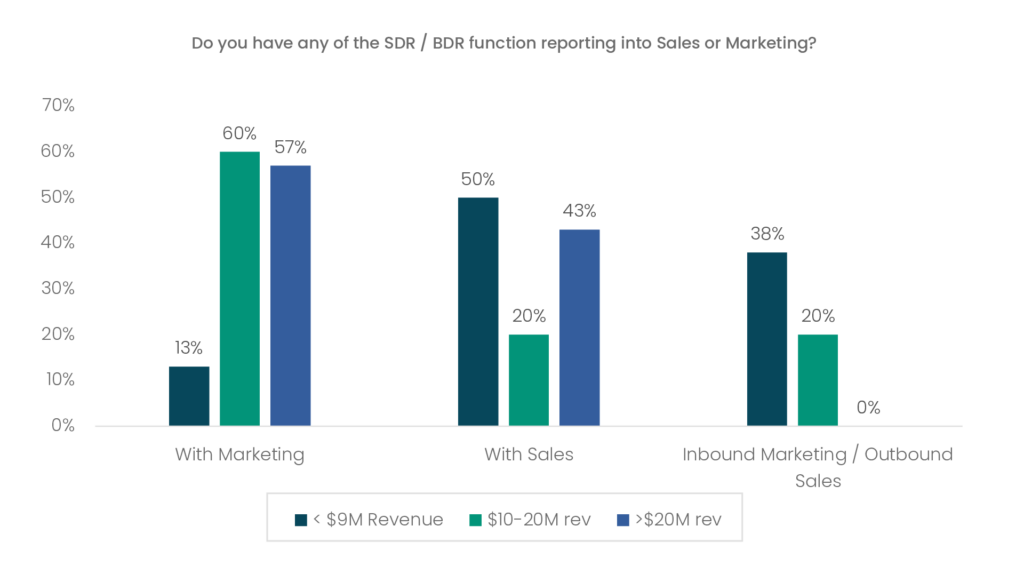
In my experience, this shift happens when companies start to identify friction in their demand gen engine. Inbound “leads” aren’t being followed up with quickly enough (negatively impacting opportunity creation), and that might be for a few reasons:
1) Revops has not prioritized systems and workflows to surface leads quickly enough.
2) The SDR / BDR team hasn’t been trained or incentivized to prioritize speed-to-lead.
3) Marketing may be blending a definition of “inbound leads” to include engaged content leads as well as true hand-raisers, creating a false sense of urgency with the lack of a prioritization rubric for their SDRs.
We also see friction in the outbound process with early-stage companies. With outbound development teams under sales, their target account lists may be created in vacuum, with no marketing inputs. The accounts selected may be cold as ice, having never heard of your products or shown any inkling they’ve got the pain you’re describing or that they’re researching solutions. In these cases, the ideal customer profile (ICP) needs to be developed jointly with marketing, sales, and product leadership in full agreement. Marketing, sales, and revops should work together to create informed lists for target accounts based on which accounts have been targeted for 1:many marketing campaigns and which accounts have shown engagement.
You don’t necessarily need to move the SDR / BDR team reporting line to achieve this alignment, but giving marketing more skin in the game for opportunity creation does help.
It may finally be time to throw out the old MQL playbook.
Look, I know it’s not a hot take to hate on the MQL. You can find headlines about the death of the MQL dating back almost 5 years. That’s why we were surprised to learn that not only are MQLs/SQLs still the #1 KPI that marketing leaders say they manage to; but they’re also still using a very traditional definition for MQLs with lead scoring.
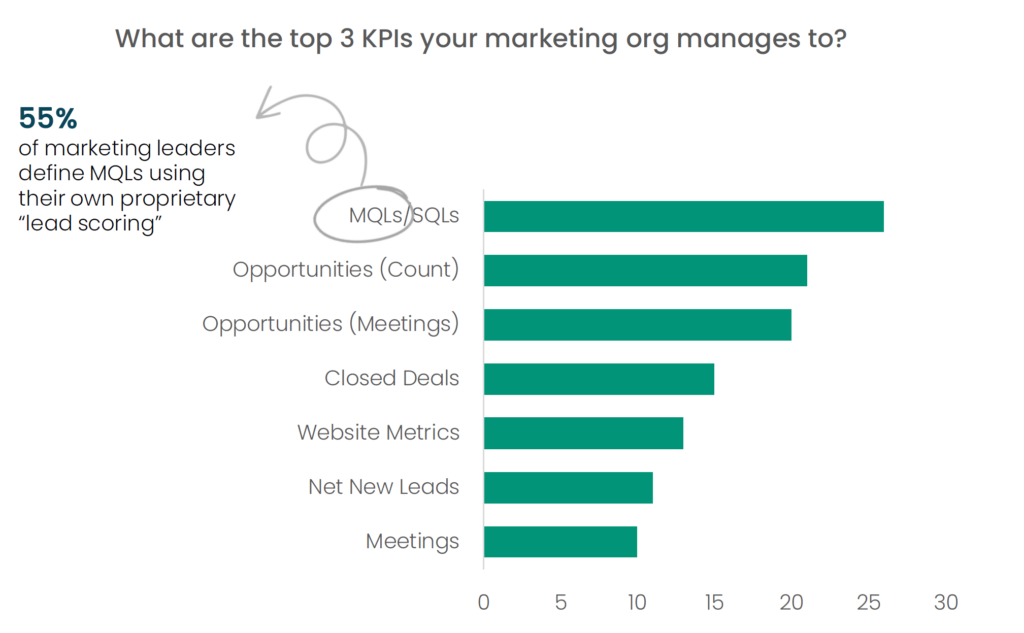
And I know some of our marketing leaders will be disappointed we didn’t include any lead lifecycle conversion rate metrics in our benchmark survey. That’s one question I’d have loved to be able to deliver on, because everyone is so hungry to know and model against what “best in class” MQL-to-opportunity conversion looks like. Here’s the problem: It’s impossible to benchmark MQL-to-opportunity conversion rates when everyone is using a proprietary metric to define what it means.
Think about it: every company has their own firmographic criteria. They have their own personas. They arbitrarily assign 2 points for this title and 5 points for this other title. The engagement scoring for webinar attendance or ebook downloads is also set with a number and adjusted over time. So while most companies are still defining MQLs the same way – using their own lead scoring – by that very definition an MQL is not going to mean the same thing company-to-company.
I shed some more light on this in my recent LinkedIn posts about inbound leads and MQL definitions. Inbound MQLs based on lead scoring are an arbitrary metric. They don’t indicate buyer-readiness. Consider only calling true hand-raisers (demo, pricing, and sales requests) “inbound leads.” Throw out MQLs entirely and use lead engagement as an “owned intent” signal to inform account scoring that your outbound team will use to prioritize accounts for their outreach.
You won’t hit your pipeline targets if your AEs aren’t outbounding to source deals.
The sales leaders in our survey are expecting on average 41 percent of deals to be sourced by BDRs and AEs combined. While marketing leaders shared that they plan to source 50 percent of pipeline, sales leaders are only counting on about 34 percent to come from marketing. Sales leaders have a better chance of hitting plan by looking at deal creation through this conservative lens.
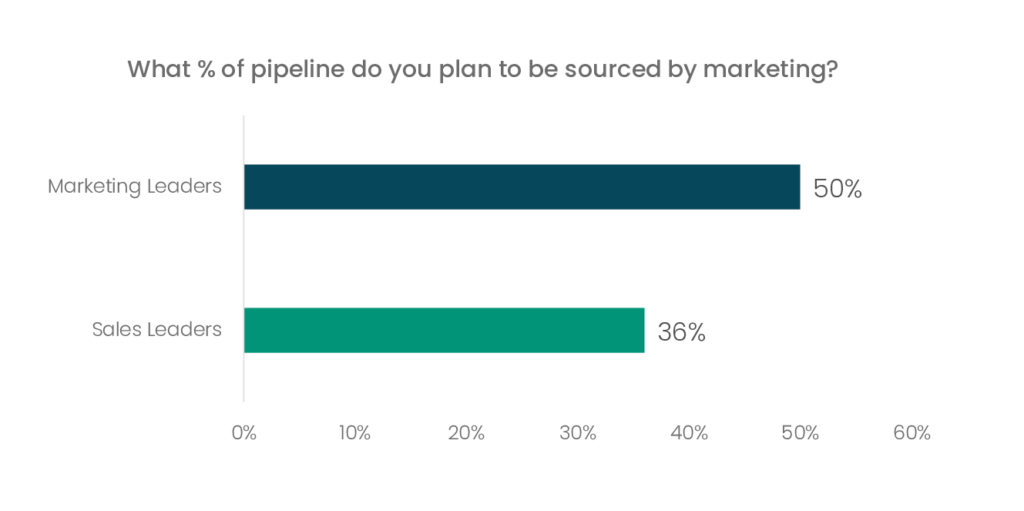
This means leaders have got to be discerning when hiring their AEs, looking for reps who have strong personal rolodexes and who aren’t afraid to mine their networks to source opportunities. The AEs should also bring a strong point-of-view in coordinating with their BDRs to cross-thread into accounts (maybe the AE takes on the outreach for the more senior personas while the BDR works the cross-functional influencers).
Revops and marketing alignment is also key to enabling your AEs to source effectively. AEs should be given a heat map that shows when accounts in their territory are showing signs of warming. With the right enablement, AEs can use this intel to inform their own cross-threading conversations and talking points as they reach out to prospective buyers.
Benchmarks are a lagging indicator of what has been – they’re not a roadmap for innovation or a new playbook.
Ultimately, you have to figure out what’s right for your specific business.
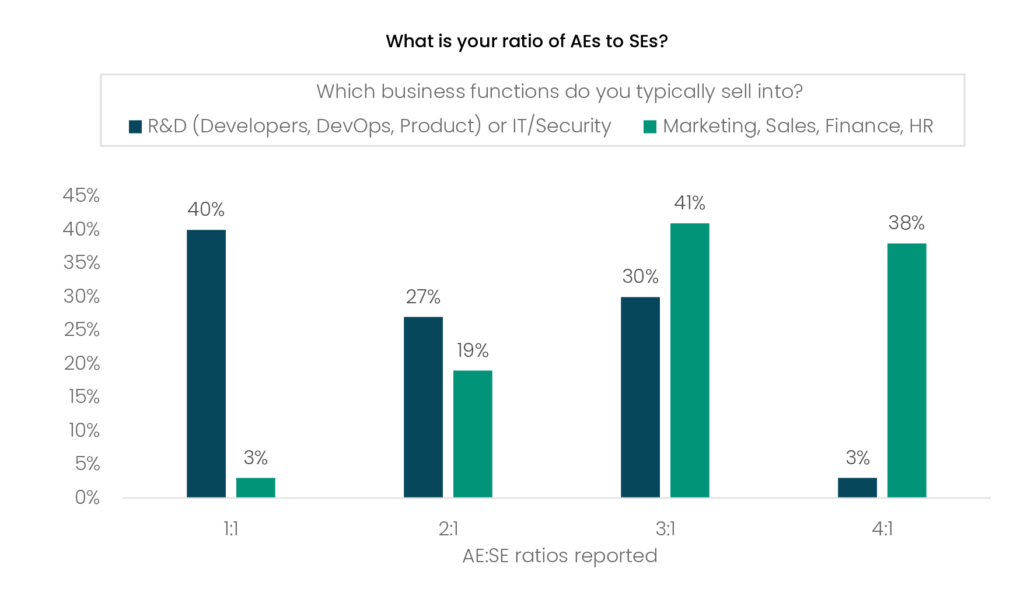
While company stage/size are one way to look at resourcing, there are other factors specific to your business you’ll need to consider. For example, we found that the personas companies sell into play a significant role in their AE-to-SE staffing ratios. Sales leaders who come from business applications sales (e.g. selling saas solutions to marketing, sales, HR, and finance) report they staff their AEs primarily by 3:1 or 4:1 ratios. We received almost the complete inverse from sales leaders selling into developers, devops, product, and IT/security teams – they’re more likely to staff at much higher ratios of 1:1 and 2:1.
Remember benchmarking is only one tool in your box. Ultimately, you need to understand your OWN baselines for performance and resourcing and set goals to improve on key metrics. Benchmarks are a lagging indicator of what has been – they’re not a roadmap for innovation or a new playbook.
Norwest remains dedicated to supporting our portfolio companies.
2024 is no doubt going to usher in new storms for us all. Norwest is in the boat with our companies, here to help you navigate the choppy waters on the way to sustainable growth.
To inform your decision-making, we plan to curate more research throughout the coming year, and we’ll continue to host many opportunities for our portfolio leaders to discuss and learn from each other about what’s working – and sometimes, even more importantly, what’s not.
For more data, download the full results from the 2023 Norwest B2B Sales & Marketing Benchmark Survey and watch the webinar below. Get the data.
