


Over the past few years, the term “Rule of 40” has been popularized within the SaaS and subscription industries to describe a business where revenue growth + EBITDA profitability exceeds 40%. Companies achieving “Rule of 40” or above are typically viewed as strong businesses deserving of high valuations. This simple formula weighs growth and profitability equally in assessing SaaS business health and value, but there may be more to this story.
“Rule of 40” may have correlated to valuation historically, but not anymore. Today, the public markets seem to favor “growth at all costs,” with revenue growth (regardless of profitability) having the best correlation to valuation. In some cases, UNPROFITABLE SaaS companies are even valued more highly than similar PROFITABLE SaaS companies growing at the same rate!
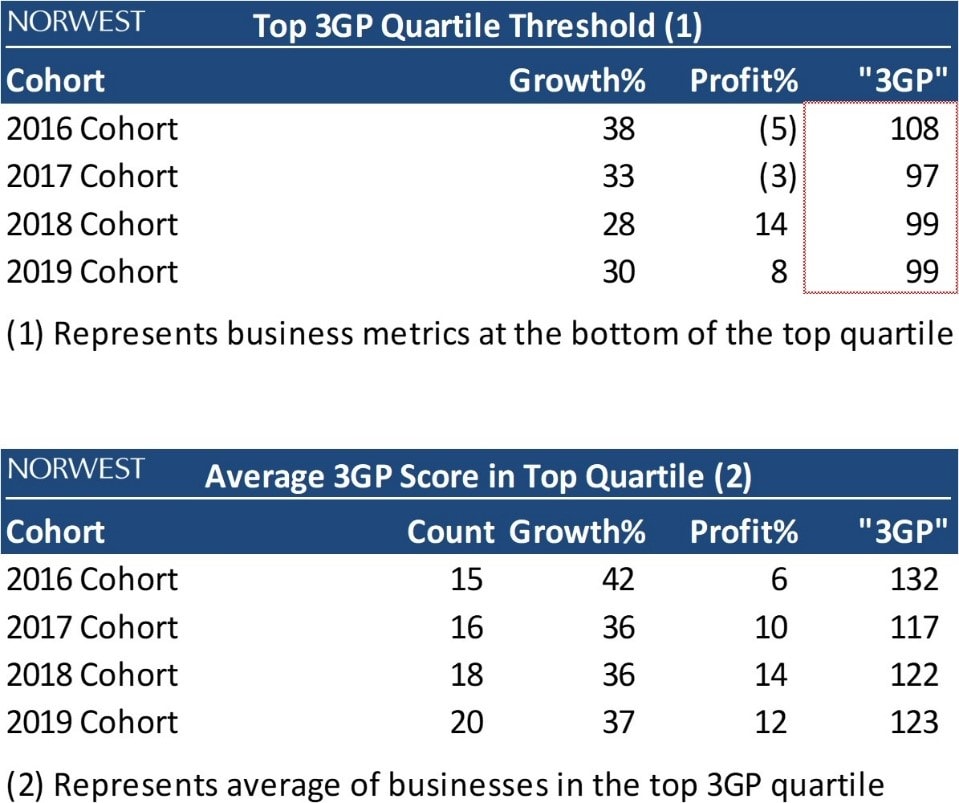
While we think recent investor sentiment is abnormal and will revert towards being mindful of profitability again, we also believe revenue growth SHOULD be valued more highly than profitability in assessing SaaS performance. At Norwest we developed a new internal metric, “3GP” (3 * revenue growth + profitability), which we believe better captures the value tradeoff between growth and profitability. As opposed to exceeding “Rule of 40,” the top quartile of public SaaS companies (ranked by 3GP) has consistently scored 100 or above under this rubric.
“Rule of 40” No Longer Correlates to Valuation
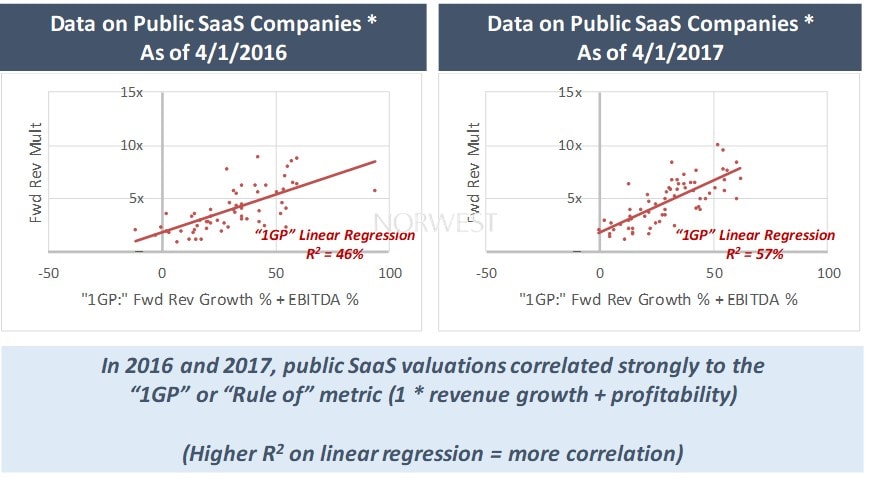
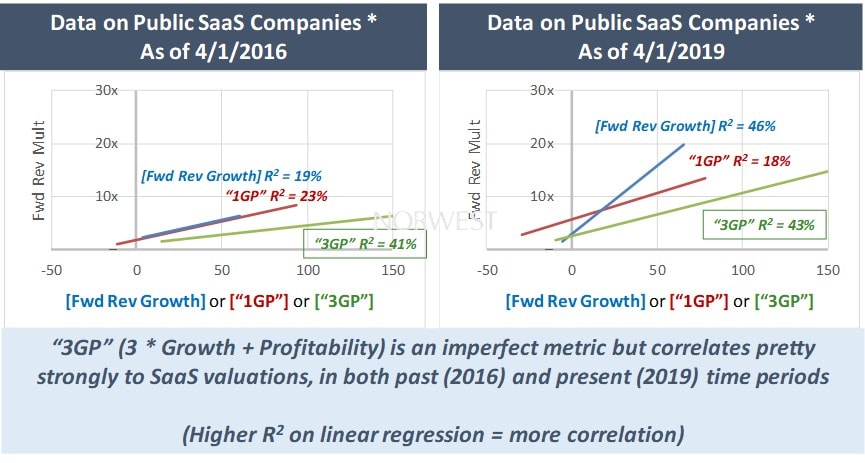
We analyzed the universe of SaaS companies that have gone public over the past 10 years (2010-2019). To minimize bias, we excluded companies that were undergoing transformative change (e.g., doubling in size due to a one-off acquisition) or that had less than 50% recurring revenue. With this company set, we charted valuation against various metrics including growth and profitability. A higher R2 on a linear regression implies the metric is more correlated to valuation.
Data from 2016 and 2017 actually DID show a fairly strong correlation between growth + profitability (“1GP,” or 1 * Growth + Profit, for short) and valuation (Forward Revenue multiple). Companies with similar 1GP’s were valued similarly in the public markets, regardless of if those companies were high growth and low profit, or low growth and high profit.
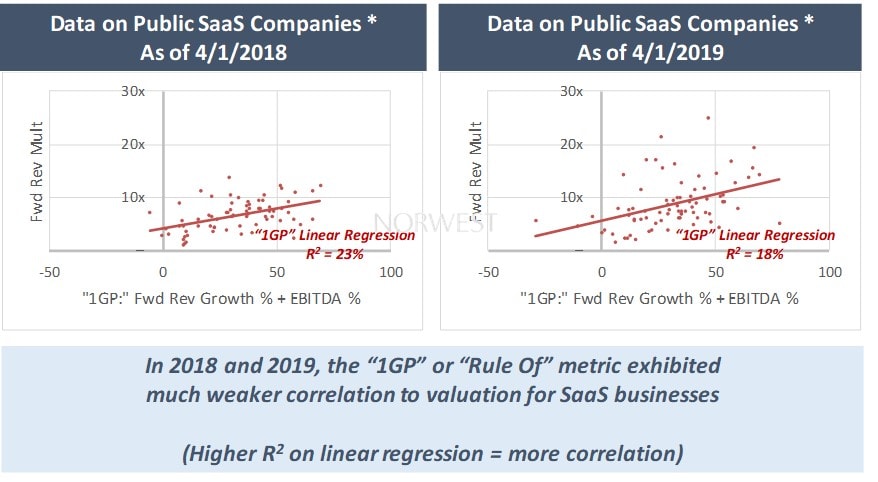
However, the same analysis for 2018 and 2019 showed a significantly lower correlation.
Recent Markets Value Growth Over All Else – To Troubling Extents
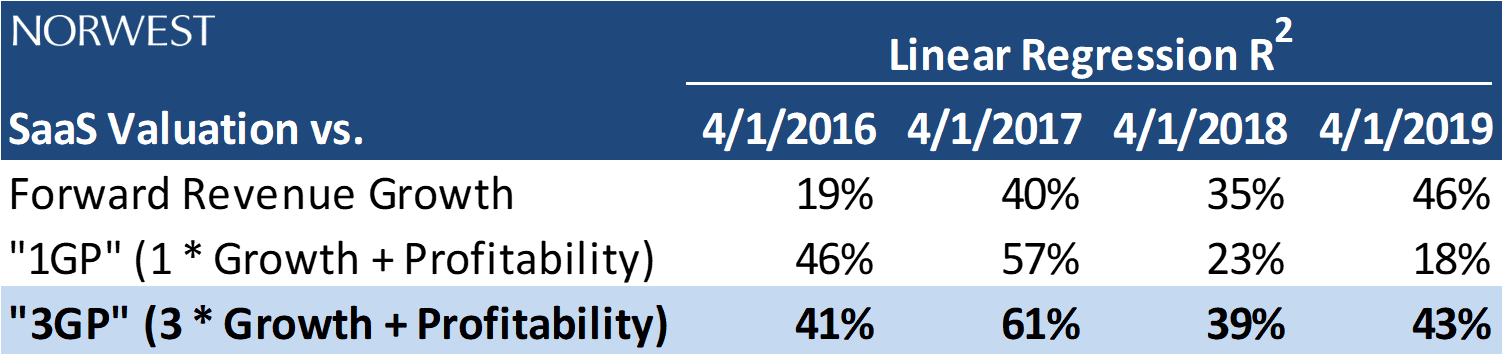
In recent years SaaS company valuations have shown an increasing correlation to just revenue growth (with no regard for profitability)…For 2019 data, linear regression for revenue growth vs. valuation had an R2 of 46%, as opposed to an R2 of just 18% for a linear regression of 1GP vs. valuation.
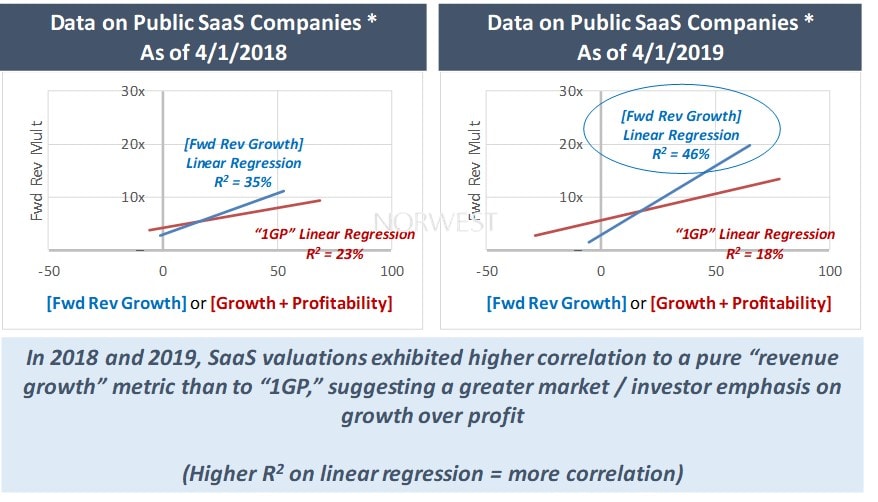
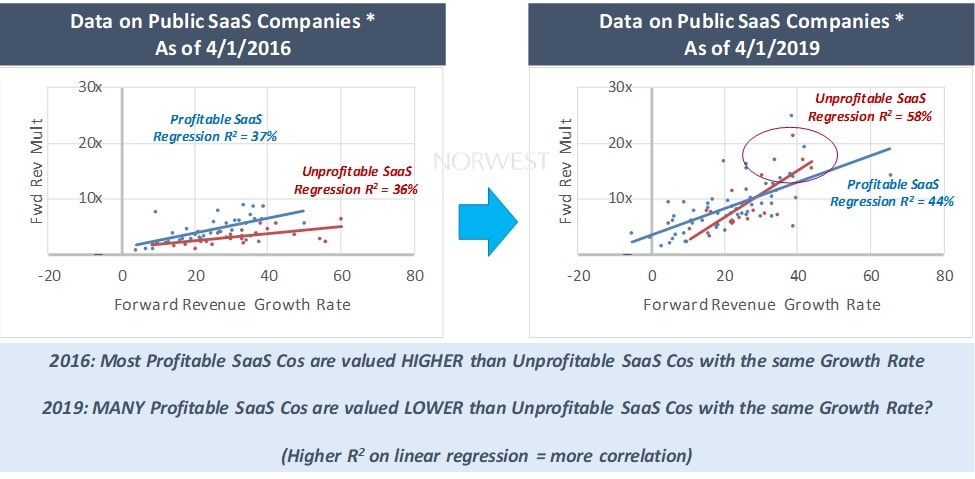
This perhaps coincides with Silicon Valley’s more recent obsession with “growth at all costs.” Alarmingly, the data seemed to suggest that in many cases SaaS investors valued an UNPROFITABLE SaaS company HIGHER than a comparable PROFITABLE SaaS company growing at the same rate!
A number of metrics contribute to a company’s valuation, but on an aggregate basis, this trend is tough to reconcile. It is possible that the select unprofitable companies that seem to be trading at abnormally high levels are actually worthy of lofty multiples due to being in markets that are more attractive, having higher quality products or management teams, or possessing other advantages that allow for more sustainable growth. That being said, we think in general this trend is unlikely to sustain and that investors will once again revert to valuing both growth AND profitability, especially as highly unprofitable businesses encounter greater challenges raising new capital.
Introducing “3GP:” Growth is more valuable than profit
A SaaS business’s valuation should be levered to both growth and profitability. However, revenue growth compounds and EBITDA profitability does not. As long as revenue growth is being attained sustainably, 1% of revenue growth today should contribute more value to a company over the long term than 1% of EBITDA profitability today. Thus, a simple “Rule Of” calculation that places equal weighting on growth and profitability doesn’t properly assess SaaS performance.
To account for the compounding value of revenue growth, we created an internal metric at Norwest that places triple the weighting on revenue growth as profitability (“3GP,” or 3 * Growth + Profit). While not perfect, we found 3GP to correlate much more consistently to SaaS valuations across the past four years.
When ranking our SaaS data set by 3GP score, we found businesses in the top quartile consistently scored 100 or better and were both growing AND profitable. Interestingly, these companies did not always meet “Rule of 40” when adding growth and profitability.
3GP is Key
We believe 3GP (3 * revenue growth + EBITDA profitability) is a more accurate measure of SaaS performance, as compared to 1GP (or the traditional “Rule of 40” metric). While profitability should not be ignored, we believe revenue growth should be valued more highly due to its compounding nature. We measure all of our SaaS businesses internally to 3GP, striving to score 100 or above as a rule of thumb.
Since our inception, our team has always believed the best way to drive value is to maximize revenue growth while maintaining a level of discipline on profitability. We have developed detailed internal benchmarks and best practices to help drive companies to 3GP 100+, with most of our companies improving on this metric over our investment period. This approach has proven to drive significant value for our shareholders, with recent successful exits/recapitalizations with Avetta, Cority, and Rainmaker (all profitable SaaS businesses). If you are looking to scale and maximize the value of your SaaS business, we’d love to speak with you as well to provide deeper insights on how to drive 3GP and value.
* Represents all SaaS companies that went public between 1/1/2010 and the “As of” date. To minimize bias, we excluded companies that were undergoing transformative change (e.g., doubling in size due to a one-off acquisition) or that had less than 50% recurring revenue.
Additional Footnotes:
- We chose to analyze data as of April 1 of each year, presuming each Company would have reported prior calendar year financials by then
- For purposes of this analysis, “Forward” Revenue Growth refers to Forecasted Revenue Growth for the current calendar year. For example, Forward Revenue Growth as of 4/1/19 refers to forecasted CY2019 Revenue Growth.
- Analysis only includes SaaS IPO’s on NYSE, Nasdaq and TSX
- All financial data from Capital IQ

